
Understanding Waymo statistics is essential for anyone tracking the future of mobility. Autonomous driving has reached a point where real numbers matter more than promises. Waymo provides those numbers. In 2026, its robotaxi service is no longer limited to one or two pilot cities. It spans major metropolitan areas.
Waymo statistics offer one of the clearest windows into the future of autonomous transportation. In 2026, the conversation around self-driving cars has shifted dramatically. Early skepticism has given way to operational data. Instead of asking whether robotaxis can work, cities and regulators are now asking how fast they can scale. Waymo sits at the center of that transition. The company is no longer defined by research milestones but by real-world usage. Paid rides are increasing every month. Safety data continues to outperform human benchmarks.
Waymo statistics show how funding translates into fleet scale. They show how rides per city reveal adoption curves. They also highlight how revenue begins to form in autonomous ride-hailing. This article breaks those elements down carefully.
Company Background: From Google Project to Waymo Robotaxi Operator
Waymo did not begin as a startup. It began inside Google. The self-driving car project launched in 2009. For nearly a decade, it remained research-focused. That changed in 2018. Waymo launched its first commercial robotaxi service in Phoenix. Real riders. Real payments. No safety driver.
Since then, Waymo self-driving cars have moved through three phases:
- Research and simulation
- Pilot deployments
- Full-scale paid ride-hailing
This context matters when reading Waymo statistics. Many competitors are still testing. Waymo is operating.
Waymo Funding and Waymo Valuation
Waymo did not follow a traditional startup fundraising path. There was no early Series A. No classic Series B timeline. That is because Waymo spent its formative years inside Alphabet.
Once external funding began, it was large and strategic.
Data from The Driverless Digest shows that Between 2020 and 2024, Waymo funding totaled $11.1 billion. Key investors included Alphabet, Fidelity, T. Rowe Price, and Perry Creek Capital.
Waymo Valuation Growth
After its October 2024 funding round, Waymo valuation exceeded $45 billion. This places Waymo among:
- The most valuable autonomous vehicle companies
- The most capitalized Waymo robotaxi operators globally
Unlike early-stage AV startups, this valuation is supported by:
- Operating revenue
- City-level deployment
- Verified safety outcomes
Waymo Revenue: From Pilot to Real Business
Waymo does not publish detailed revenue statements. But Waymo statistics around rides allow directional analysis.
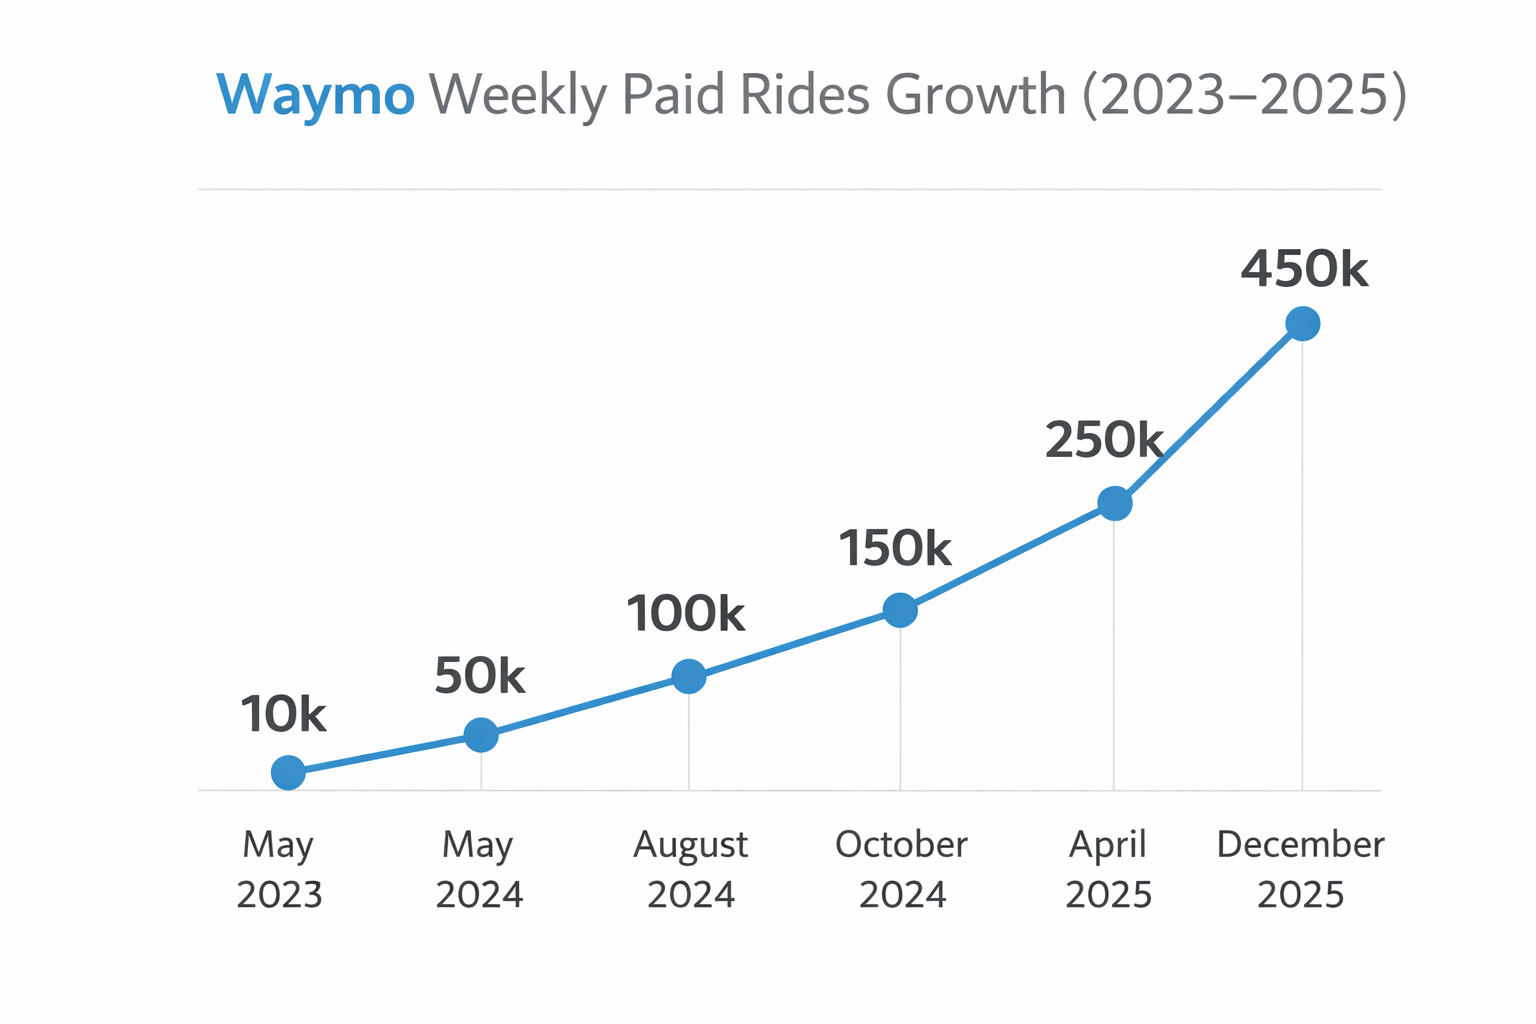
Weekly Ride Growth
Waymo’s weekly paid rides increased rapidly. Data from the Driverless Digest and Tesla Robotaxi Tracker shows that:
- May 2023: 10,000
- May 2024: 50,000
- August 2024: 100,000
- October 2024: 150,000
- April 2025: 250,000
- December 2025: 450,000
This is compounding growth, not linear growth.
Estimated Waymo Revenue Run Rate
According to pricing analysis:
- Waymo average ride price in San Francisco: $20.43
- Lyft average: $14.44
- Uber average: $15.58
At 450,000 weekly rides, this suggests a Waymo revenue run rate above $400 million annually, depending on city mix and pricing changes. Waymo revenue is no longer theoretical.
Waymo Rides Per City: Active Markets Breakdown
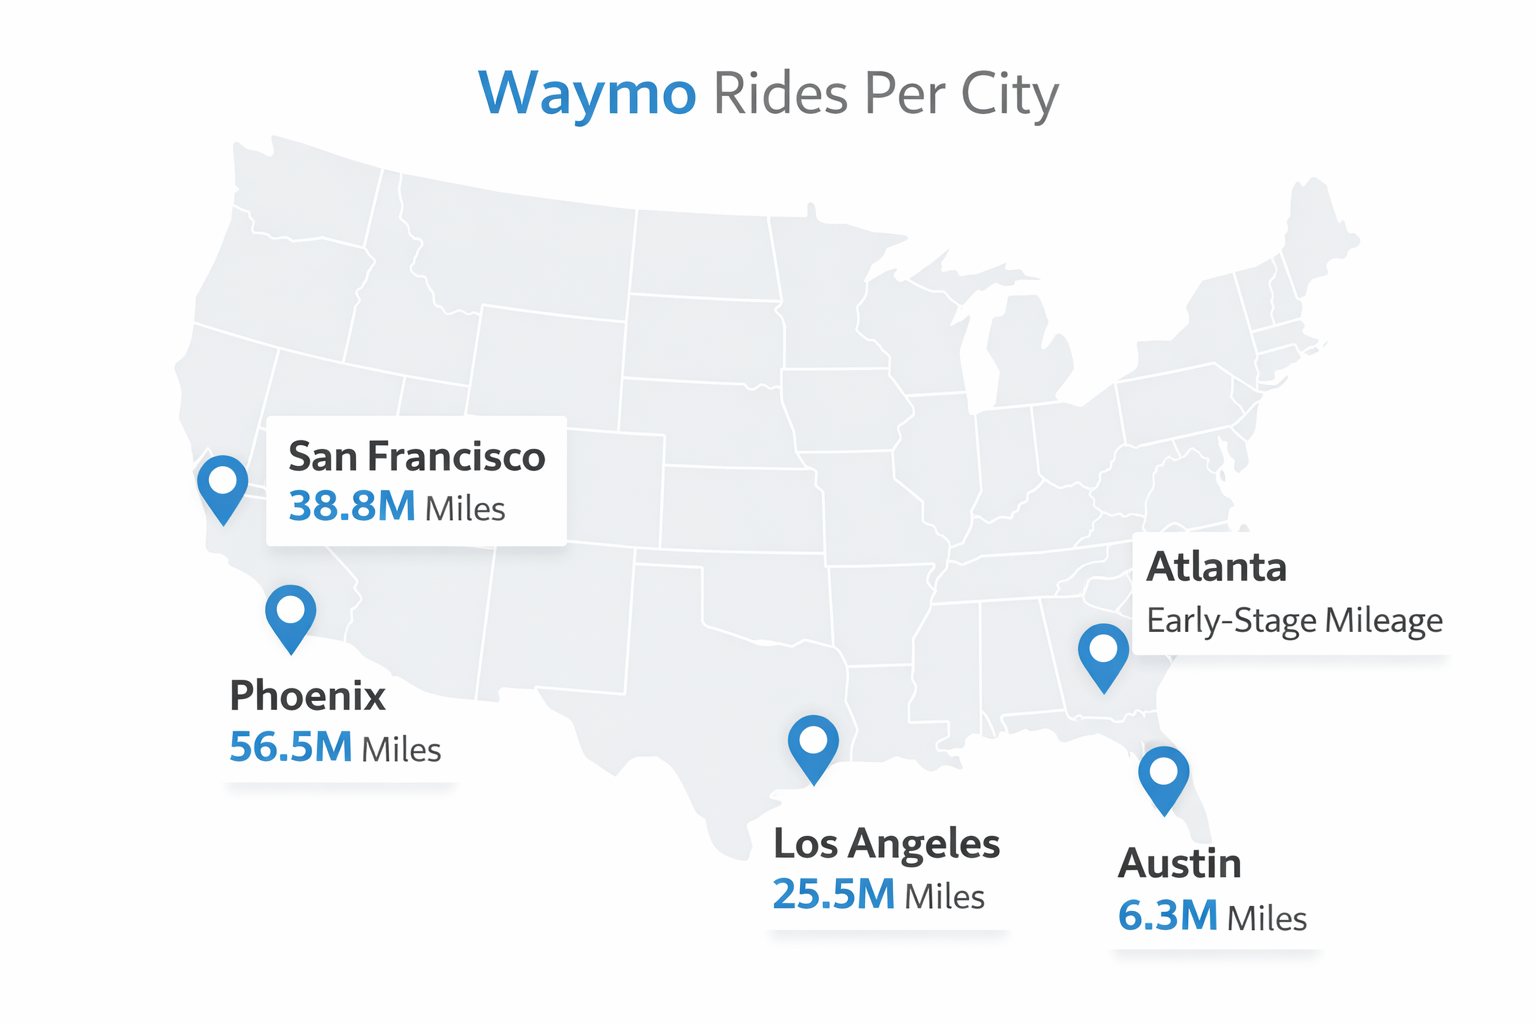
Waymo currently operates paid robotaxi services in five U.S. cities. Each city plays a distinct role in Waymo’s scaling strategy.
Phoenix
- First commercial launch (2018)
- Airport service at Phoenix Sky Harbor
- Largest rider-only mileage: 56.5M miles
San Francisco
- Public launch: June 25, 2024
- Full city and freeway coverage
- Rider-only miles: 38.8M
Los Angeles
- Public launch: November 12, 2024
- Service area: 120+ square miles
- Rider-only miles: 25.47M
Austin
- Waymo robotaxi accessed via Uber
- Service area: 90 square miles
- Rider-only miles: 6.34M
Atlanta
- Public launch: June 24, 2025
- Uber-exclusive booking
- Early-stage mileage data
Waymo Market Share Signals
Waymo no longer publishes direct market share figures. Third-party estimates still provide insight.
San Francisco
- Reached parity with Lyft in late 2024
- Surpassed Lyft within Waymo’s operating zone by mid-2025
Austin
- Nearly 20% of Uber rides inside Waymo’s operating zone
- Around 6% of all Uber rides metro-wide
These Waymo market share signals are notable given fleet size.
Waymo Autonomous Vehicles and Fleet Economics
As of November 2025, Waymo operated ~2,500 autonomous vehicles, mostly in California.
Vehicle Platforms:
Current:
- Jaguar I-PACE
Upcoming:
- Zeekr RT
- Hyundai IONIQ 5
These models aim to lower cost per Waymo self-driving car.
Cost Per Vehicle:
- Jaguar I-PACE MSRP: ~$75,000
- Autonomy hardware: ~$100,000
- Total per vehicle: ~$175,000
Waymo Safety Statistics
Safety is what allows Waymo robotaxi expansion. Rider-Only Miles:
- Total rider-only miles: 127 million
- Phoenix: 56.535M
- San Francisco: 38.816M
- Los Angeles: 25.47M
- Austin: 6.337M
Crash Reduction vs Humans
Compared to human drivers:
- 90% fewer serious injury crashes
- 81% fewer injury-causing crashes
- 82% fewer airbag deployments
Independent Validation
Peer-reviewed analysis found:
- 85% fewer serious injuries
- 96% fewer intersection crashes
Waymo Robotaxi Expansion Roadmap (2026)
Announced U.S. Cities
- Detroit
- Las Vegas
- San Diego
- Dallas
- Miami
- Washington, D.C.
- Denver
- Seattle
- Nashville
International Expansion
- London (testing first, public service expected in 2026)
- Tokyo (data collection only)
Waymo Statistics Snapshot (2026 Baseline)
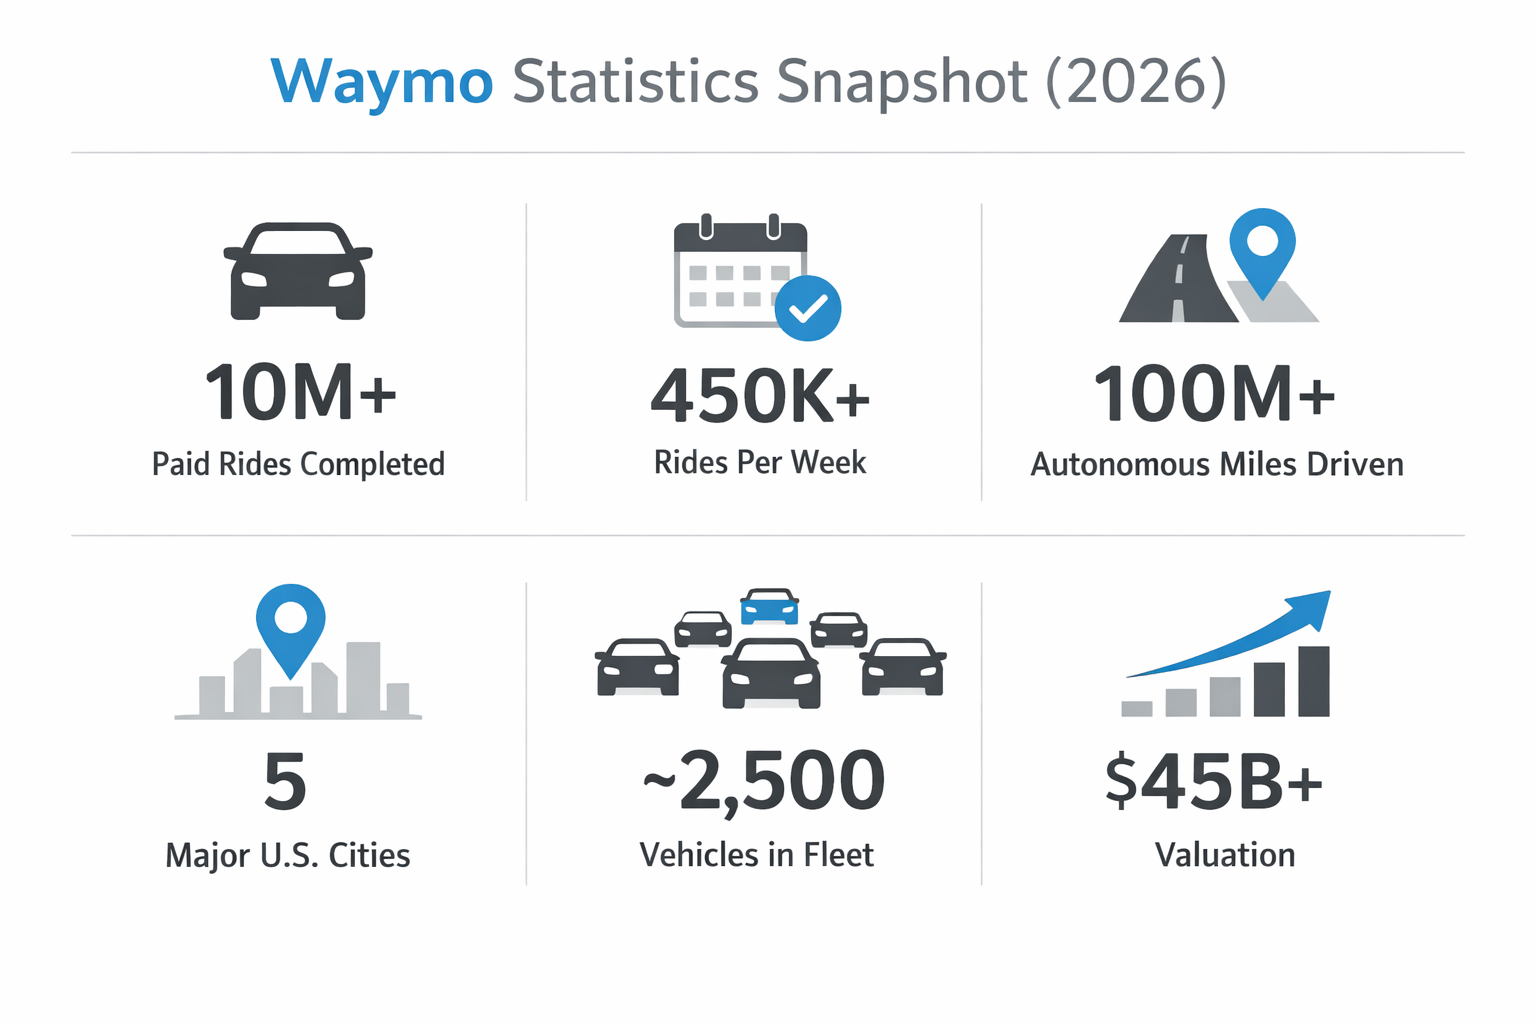
Before diving deeper, here is a high-level snapshot of Waymo statistics as we enter 2026.
- Over 10 million paid autonomous rides completed
- More than 100 million autonomous miles driven on public roads
- 450,000+ paid rides per week by December 2025
- Active operations in 5 major U.S. cities
- A fleet of roughly 2,500 Waymo autonomous vehicles
- Waymo valuation above $45 billion
These Waymo statistics establish the scale. Now let’s examine what drives them.
What Waymo Statistics Tell Us About the Future
Waymo statistics tell a clear story.
This is not a prototype. This is not a pilot. This is a scalable transportation system. Waymo statistics show that autonomous mobility is no longer coming. It is already here.
Scale Trust for AI Companies Through Authority SEO
In AI, credibility matters more than hype. AWISEE builds search authority for AI companies using data-driven SEO and high-quality link building that positions innovation as operational reality.