

Time Spent on TikTok Statistics offer one of the clearest lenses into how digital attention behaves in 2025. TikTok is not growing because people have more free time. It is growing because it captures attention in short, repeated moments throughout the day. Those moments add up quickly. When average monthly usage reaches more than thirty hours, TikTok becomes part of daily life rather than a destination app.
TikTok usage time statistics show that users do not simply scroll once and leave. They return dozens of times each day. TikTok screen time data also reveals that session length is longer than on nearly every competing platform. That combination of frequency and depth explains why TikTok reshapes content discovery and consumer behavior. This report examines how TikTok daily usage time, monthly usage statistics, and engagement patterns have evolved. Each insight is grounded in verified data rather than assumptions. Together, these Time Spent on TikTok Statistics explain why attention economics increasingly revolve around TikTok.
Time Spent on TikTok Statistics: 2025 Snapshot
Before going deeper, it helps to review the benchmarks that define TikTok usage time statistics today.
Key Time Spent on TikTok Statistics (2025)
Data collected by Cropink and Exploding topics shows that:

- Average monthly time spent on TikTok: ~34 hours
- TikTok daily usage time: ~56 minutes
- Average TikTok session length: ~11 minutes
- Average daily app opens: ~19 times
- Share of total social media time in the U.S.: 32%
These figures explain why TikTok consumption data stands apart from other platforms. No major social app combines this level of frequency and session depth at scale.
Turn TikTok Attention Into Measurable Growth
AWISEE helps brands convert TikTok screen time into real engagement, trust, and revenue through creator-led influencer strategies designed for 2025 behavior.
TikTok Monthly Usage Statistics: Where “34 Hours” Comes From
The headline number appears everywhere, but understanding TikTok monthly usage statistics requires context.
Average Monthly Time Spent on TikTok (Global)
The average TikTok user spends about 34 hours per month scrolling the app.
That equals:
- More than 1 hour per day
- Nearly 3% of an entire month
- Around 5% of total waking hours
This level of TikTok average time spent shows intentional usage, not passive consumption.
Countries With the Highest TikTok Screen Time Data
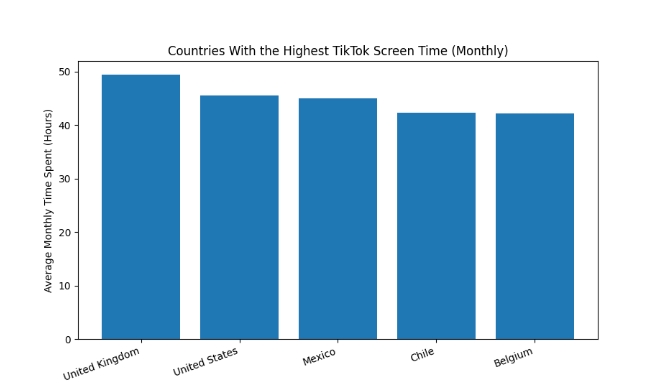
TikTok screen time data shows strong regional variation, yet heavy usage exists almost everywhere. Top countries by average monthly TikTok screen time:
- United Kingdom: 49h 29m
- United States: 45h 37m
- Mexico: 45h 01m
- Chile: 42h 21m
- Belgium: 42h 13m
Countries With the Lowest TikTok Screen Time
Lower usage does not mean low engagement.
- Switzerland: 27h 57m
- Taiwan: 28h 04m
- South Korea: 28h 10m
- Ireland: 28h 16m
Even the lowest-ranked countries still show extremely high TikTok monthly usage statistics.
TikTok Daily Usage Time: How 34 Hours Breaks Down
Monthly totals feel abstract. TikTok daily usage time reveals habit formation.
Average Daily Time Spent on TikTok
In 2024–2025, the average user spends 55 minutes and 48 seconds per day on TikTok.
This figure has more than doubled since 2019.
Daily Time Spent on TikTok Over Time
- 2019: 27m 24s
- 2020: 38m 36s
- 2021: 45m 18s
- 2022: 52m
- 2023: 55m 48s
- 2024: 58m 24s
This steady rise reinforces the long-term trend behind Time Spent on TikTok Statistics.
TikTok Session Behavior: Frequency and Depth
TikTok usage time statistics are shaped by both frequency and depth.
How Often People Open TikTok
The average user opens TikTok around 19 times per day.
This pattern turns TikTok into a background habit throughout the day.
Average TikTok Session Length
Average TikTok session length is 10.85 minutes.
TikTok Session Length vs Other Social Apps
Average session duration (minutes):
- TikTok: 10.85
- Pinterest: 5.06
- Reddit: 4.96
- Facebook: 4.82
- Instagram: 2.95
This explains why TikTok user engagement statistics outperform competitors.
Time Spent on TikTok vs Other Social Media Apps
TikTok does not compete evenly. It dominates.
Monthly time spent by platform:
- TikTok: 34h 00m
- YouTube: 28h 05m
- Facebook: 19h 47m
- Instagram: 15h 50m
- LinkedIn: 0h 51m
Share of Social Media Time in the U.S.
- TikTok: 32%
- Facebook: 20%
- Instagram: 20%
- YouTube: 15%
This confirms TikTok’s role as the primary attention platform.
TikTok Usage Time Statistics by Age Group
Time Spent on TikTok Statistics vary sharply by age.
Average Daily Time Spent on TikTok by Age
- 18–24: 57 minutes
- 25–34: 28 minutes
- 35–44: 19 minutes
- 45–54: 9 minutes
- 55–64: 7 minutes
- 65+: 3 minutes
Children and Teenagers: TikTok Screen Time Report
Youth screen time remains one of the most sensitive parts of TikTok screen time data.
- Global teens (11–17): 75 minutes/day
- U.S. teens: 87 minutes/day
- UK teens: 70 minutes/day
Additionally:
- 22% of U.S. teens spend 2–3 hours daily on TikTok
TikTok User Engagement Statistics: What Users Actually Do
Data collected by AWISEE shows that TikTok downloads worldwide reached 436.82 million across iOS + Android in the first 6 months of 2025. High TikTok consumption data reflects active intent.
User activities include:
- Entertainment: 80.3%
- Brand and product research: 44.9%
- News consumption: 39%
- Posting content: 39.4%
- Messaging: 17.9%
TikTok Screen Time Report: What This Means for Advertisers
Time Spent on TikTok Statistics point to one clear conclusion. Attention lives here.
- TikTok ad reach: 1.56 billion users
- Users researching products: 44.9%
Time Spent on TikTok Statistics in 2025 show a platform that owns attention consistently. Users return multiple times per day. They stay longer than many competing apps. They watch, research, and decide inside one feed. Thirty-four hours is not excess. It is the new baseline.
Reach Gen Z and Millennials Where They Stay Longest
AWISEE specializes in TikTok influencer marketing strategies that speak the language of short-form video, cultural relevance, and creator credibility—without disrupting the user experience.