

Time spent on Instagram statistics are one of the strongest indicators of platform relevance in 2025. Social networks rise and fall based on attention, not installs. Instagram continues to hold a strong position because users stay. They watch. They scroll. They return.
Instagram usage statistics 2025 show that the platform has matured. Growth now comes less from new users and more from deeper daily engagement. This shift explains why Instagram usage time remains high even as competition intensifies. Short-form video, particularly Reels, plays a central role in this behavior.
By analyzing Instagram screen time data alongside age-based and country-level breakdowns, this report explains how time is actually spent. It also highlights why Instagram engagement statistics differ so sharply between generations. For brands and creators, understanding these patterns is no longer optional. It is foundational to performance in 2025.
Turn Instagram Screen Time Into Brand Impact
AWISEE helps brands convert daily Instagram usage time into real awareness and measurable engagement through creator partnerships.
Time Spent on Instagram Statistics: 2025 Snapshot
Instagram usage time in 2025 is already well established. Data collected by AWISEE shows 2 billion people use Instagram every month. The platform is no longer growing because it is new. It is growing because it is habitual.
Key Time Spent on Instagram Numbers (At a Glance)
Instagram usage time in 2025 is already well established. The platform is no longer growing because it is new. It is growing because it is habitual.
Data collected from Cropink and Backlinko shows most important time spent on Instagram statistics to know:
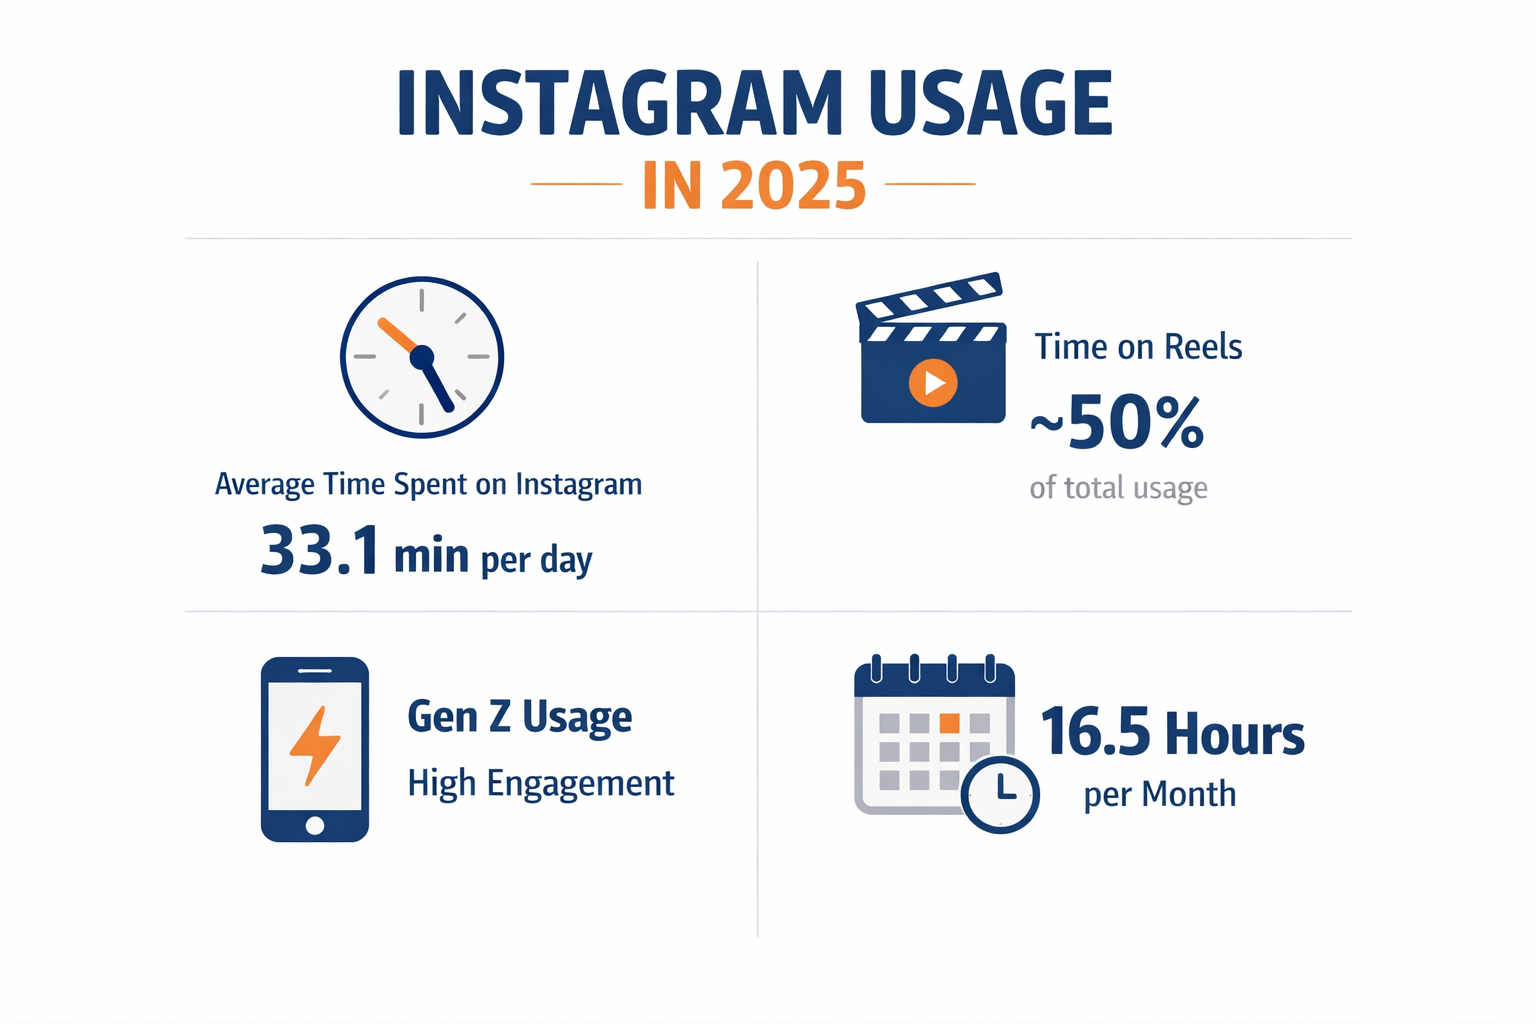
- Average time spent on Instagram per day: 33.1 minutes
- Monthly equivalent: ~16.5 hours
- Gen Z spends significantly more time than older generations
- Nearly 50% of total Instagram time is spent watching Reels
What These Numbers Signal
These time spent on Instagram statistics point to three clear signals:
- Instagram is a daily platform, not an occasional one
- Short-form video dominates Instagram screen time data
- Younger users carry a disproportionate share of total usage
This snapshot sets the foundation for every other Instagram usage statistic that follows.
Average Daily Time Spent on Instagram in 2025
Instagram users worldwide spend about 33 minutes per day on the platform. This figure reflects total engagement, not just quick opens.
Daily Instagram usage time includes:
- Scrolling the feed
- Watching Reels
- Viewing Stories
- Browsing Explore
Statistic:
Average daily time spent on Instagram globally: 33.1 minutes
Monthly Perspective: What 33 Minutes Really Means
Thirty-three minutes per day may not sound extreme. But over time, it compounds quickly.
- 33.1 minutes per day
- ≈ 16 hours 30 minutes per month
That equals nearly two full workdays every month spent on Instagram. This monthly perspective helps contextualize Instagram screen time data more realistically.
Instagram Usage Statistics 2025 vs Other Platforms: How Instagram Compares on Daily Usage Time
Instagram performs strongly, even if it does not lead the market.
Here is how Instagram daily usage time compares with other major platforms in the United States:
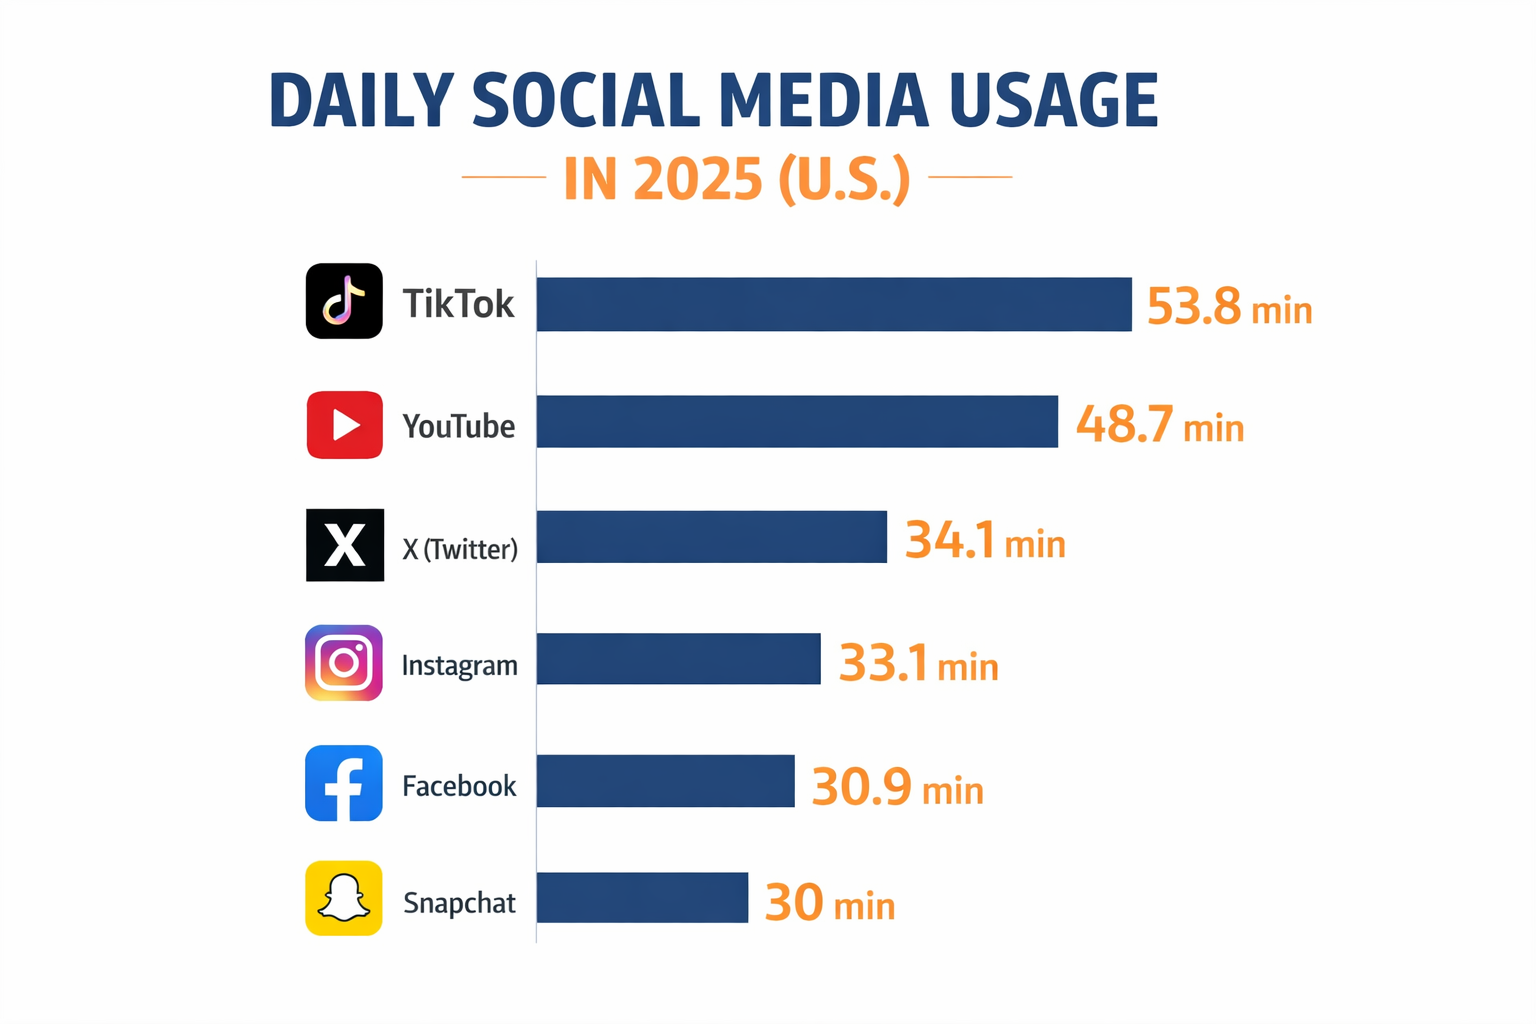
- TikTok: 53.8 minutes per day
- YouTube: 48.7 minutes per day
- X (Twitter): 34.1 minutes per day
- Instagram: 33.1 minutes per day
- Facebook: 30.9 minutes per day
- Snapchat: 30 minutes per day
What This Comparison Tells Us
Instagram sits comfortably in the top tier of attention platforms.
Key takeaways from these Instagram usage statistics 2025:
- Instagram competes directly with TikTok for short-video attention
- It outperforms most text-centric platforms
- It remains resilient despite algorithm changes and ad saturation
This explains why Instagram continues to be central to brand and creator strategies.
Time Spent on Instagram by Generation and Age
Instagram user behavior statistics show a clear generational divide.
- Gen Z spends 53 minutes per day on Instagram
- Gen X spends 28 minutes per day
That means Gen Z spends nearly double the time Gen X does.
Why the Gen Z Gap Matters
This difference affects nearly every strategic decision:
- Content pacing
- Creative formats
- Posting frequency
- Platform investment priorities
Gen Z does not visit Instagram casually. They stay.
Time Spent on Instagram by Age Group (U.S.)
Instagram daily usage time varies significantly by age.
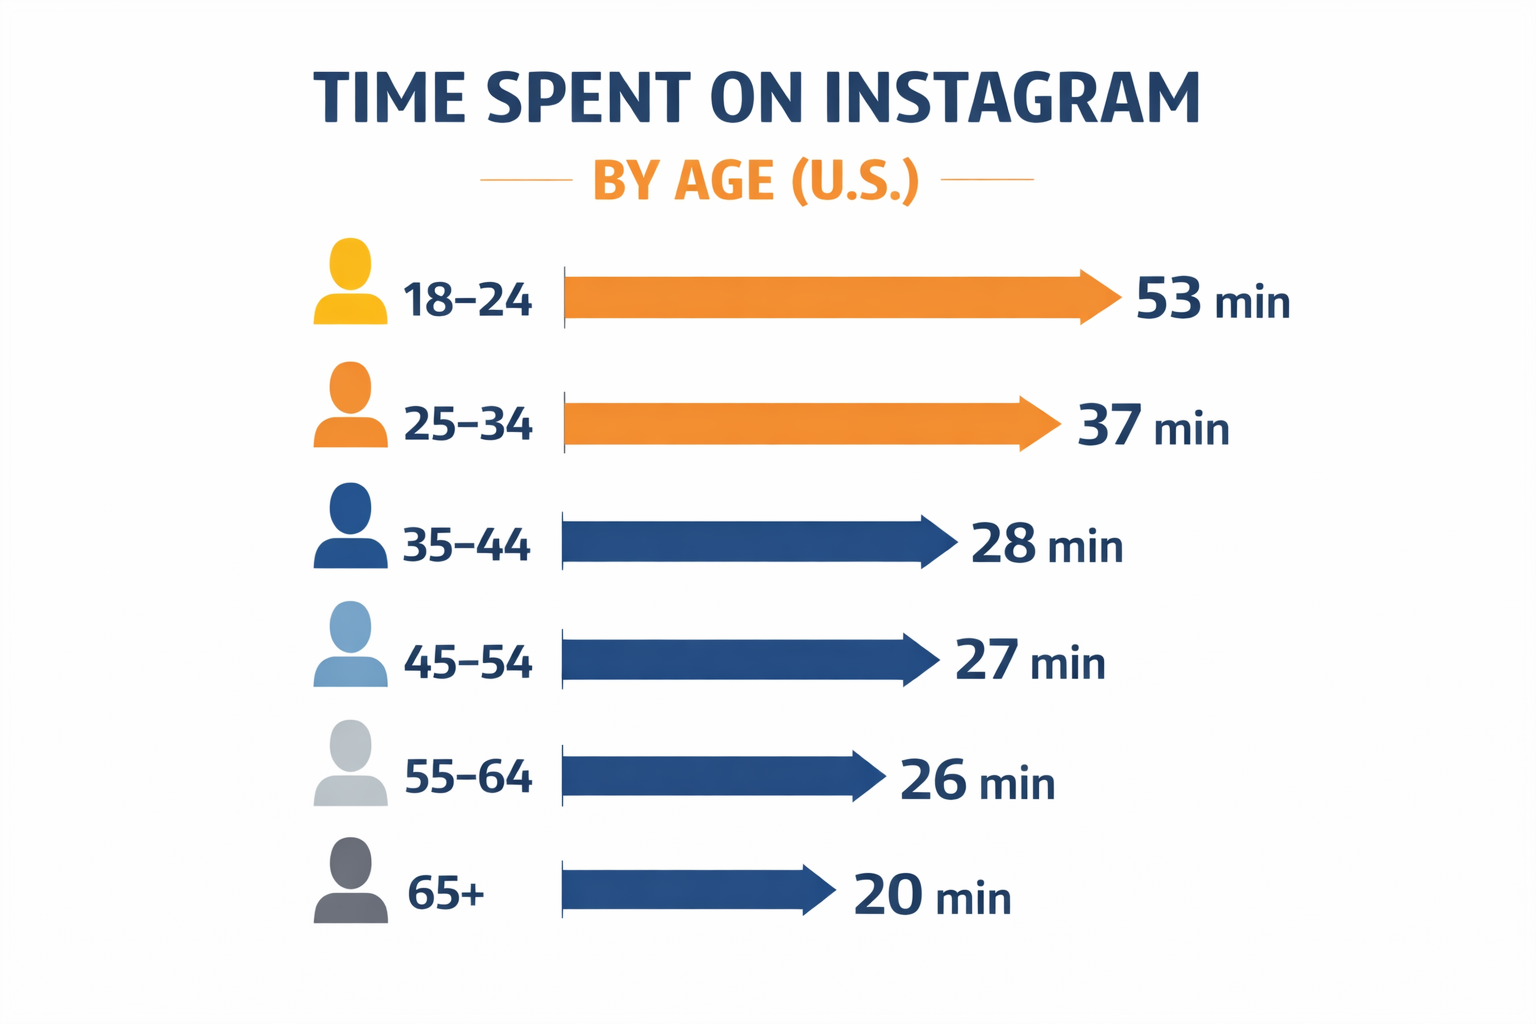
Average daily time spent by U.S. adults:
- 18–24 years: 53 minutes
- 25–34 years: 37 minutes
- 35–44 years: 28 minutes
- 45–54 years: 27 minutes
- 55–64 years: 26 minutes
- 65+ years: 20 minutes
Pattern Worth Noticing
Two patterns stand out in this Instagram screen time data:
- Usage drops steadily with age
- The steepest decline occurs after age 34
This explains why Instagram remains youth-heavy despite broad global adoption.
Instagram Screen Time Data by Country
Instagram usage statistics 2025 show significant differences by geography.
- Turkey records the highest Instagram usage time
- Average time spent in Turkey: 21.24 hours per month
This is far above the global average.
Why Country Differences Matter
Country-level Instagram screen time data helps explain:
- Cultural content consumption habits
- Video-first versus feed-first behavior
- Advertising effectiveness by region
High-time markets often support:
- Strong creator economies
- Dense engagement cycles
- Faster trend adoption
What Are People Doing on Instagram?
One of the most important Instagram user behavior statistics in 2025 is simple.
Nearly half of all time spent on Instagram goes to Reels.
That equals:
- About 17.6 million hours per day watching Reels content
Content Preferences on Instagram
Instagram engagement statistics reveal clear content preferences.
- 50% of users prefer funny or entertaining content
- Only 28% engage primarily with helpful or how-to posts
What This Means in Practice
Instagram is not a utility platform first. It is an entertainment platform first.
This explains:
- Why humor spreads faster
- Why short videos outperform static posts
- Why educational content needs strong hooks
Is More Instagram Screen Time Creating Attention or Distraction?
Time spent on Instagram statistics raise a natural question in 2025.
Does more Instagram screen time data reflect deeper engagement, or does it simply show endless scrolling?
The data points to something specific.
Instagram screen time is not evenly distributed across activities. Users are not randomly multitasking. Instead, attention is concentrated around a few dominant formats. The biggest driver of that concentration is short-form video.
Attention Quality on Instagram in 2025
Nearly 50% of all time spent on Instagram is now devoted to Reels.
That matters because Reels are:
- Algorithmically prioritized
- Designed for rapid consumption
- Optimized for repeat viewing
As a result, Instagram engagement statistics show attention that is:
- Fast
- Emotional
- Loop-based
Statistic:
Share of total Instagram usage time spent on Reels: ~50%
This concentration explains why Instagram user behavior statistics now favor motion, sound, and immediacy over static browsing.
Informed or Distracted? What the Data Suggests
Instagram user behavior statistics also show a strong content preference gap.
- 50% of users prefer funny or entertaining content
- Only 28% primarily engage with helpful or how-to posts
This difference matters. It suggests that Instagram is not the platform users choose first for deep learning. They use Instagram to feel entertained quickly. Education still works, but only when wrapped in entertainment.
This insight helps explain why Instagram daily usage time continues to hold strong even as content density increases.
Instagram Engagement Statistics: Is Advertising Worth It?
Time spent on Instagram statistics help answer a critical business question.
Is this attention valuable?
The answer depends on who you target and how you show up inside that time window.
Who Gives Instagram the Most Time?
Instagram daily usage time is not evenly distributed across age groups.
The highest engagement comes from younger users:
- Ages 18–24: 53 minutes per day
- Ages 25–34: 37 minutes per day
Older users still use Instagram regularly, but they spend less time per session.
This distribution explains why Instagram engagement statistics skew heavily toward youth-oriented content formats.
What This Means for Brands
High Instagram usage time creates opportunity, but only when the format fits user behavior.
Instagram works best for:
- Awareness
- Discovery
- Repetition
- Visual storytelling
It performs less effectively for:
- Long explanations
- Text-heavy education
- Slow conversion funnels
Time spent on Instagram statistics show that attention exists, but it must be earned quickly.
Instagram Usage Trends 2025 Brands Should Watch Closely
Instagram usage trends 2025 reveal a platform that has stabilized in size but intensified in behavior.
Instagram is no longer chasing growth through new users. Instead, it is increasing depth among existing ones.
Trend 1: Instagram Has Become a Habit Platform
Users now spend 33+ minutes per day on average.
That level of consistency turns Instagram into a daily routine rather than an occasional destination.
Statistic:
Average global Instagram daily usage time: 33.1 minutes
This habit formation explains why time spent on Instagram statistics remain stable even as competition grows.
Trend 2: Reels Are the Default Entry Point
Half of total Instagram screen time data now flows through Reels.
This means:
- Static posts support Reels
- Stories reinforce Reels
- Reels drive discovery
Instagram usage statistics 2025 confirm that video is no longer optional. It is foundational.
Trend 3: Younger Users Carry Instagram’s Attention Economy
Gen Z spends nearly double the time Gen X does on Instagram.
This gap shapes:
- Creator growth patterns
- Brand tone and language
- Visual and audio trends
Instagram usage trends 2025 clearly favor creators and brands that understand younger attention cycles.
Best Time to Post on Instagram Based on Usage Patterns
Instagram engagement statistics are closely tied to timing.
Posting when users are active increases the chance of appearing inside those limited daily minutes.
Best Overall Posting Window
The most effective general posting window is:
- 9:00 AM to 1:00 PM
This window captures:
- Morning scroll behavior
- Midday breaks
- Early engagement momentum
Best Days and Times
Highest engagement periods include:
- Tuesday at 10:00 AM
- Thursday between 9:00 AM and 11:00 AM
Sunday generally produces lower interaction.
Why Time Zones Matter
Instagram usage time varies by geography.
Brands with international audiences should:
- Use Instagram Insights
- Identify top audience cities
- Adjust posting schedules accordingly
This aligns posting decisions with real Instagram screen time data rather than assumptions.
What These Instagram Time Metrics Mean in 2025
Time spent on Instagram statistics tell a clear story.
Instagram has become:
- A daily habit
- A video-first platform
- An entertainment-driven ecosystem
Users may not read deeply. They may not search intentionally. But they stay.
For creators and brands, success comes from respecting how Instagram usage time actually works.
Reach Gen Z Where Instagram Attention Is Highest
AWISEE connects brands with Instagram creators who already command Gen Z trust and understand short-form video behavior.