

Temu is no longer an experimental shopping app. These Temu Statistics confirm that it has become a global ecommerce force with hundreds of millions of users, billions in sales volume, and massive daily engagement.
What makes Temu Statistics especially important is speed. Within three years of launch, Temu moved from near-zero awareness to mainstream adoption across the United States, Europe, and several international markets. Temu user growth, Temu revenue 2025 projections, and Temu shopping app statistics all point in the same direction: Temu is now structurally embedded in global ecommerce behavior.
This article breaks down the most important Temu Statistics using verified data only. Each section focuses on usage, revenue, traffic, and business fundamentals to explain how Temu scaled so fast and what that scale actually looks like in numbers.
Win Visibility Inside a 400M+ User Marketplace
Temu’s explosive growth means visibility is no longer guaranteed. Ranking, promotion timing, and creative positioning now determine success. AWISEE helps sellers design Temu-specific marketing strategies that improve product discovery, click-through rates, and conversion performance.
Temu Users Statistics: Global User Base in 2025
Temu users statistics show one of the fastest user adoption curves in modern ecommerce history.
Monthly Active Users Worldwide
Data collected from Backlinko shows that:
- 416.5 million monthly active users worldwide (Q2 2025)
This figure represents global app usage and confirms Temu’s transition from early growth to large-scale adoption.
For historical context:
- Q1 2023: 23.4 million MAU
- Q1 2024: 167 million MAU
This growth explains why Temu growth statistics are now closely tracked by analysts and competitors.
Temu User Growth by Region

Temu user growth is not evenly distributed. Regional data explains where momentum is accelerating and where saturation is emerging.
United States
- 133.6 million monthly active users (Oct 2025)
- 28% year-over-year decline
The decline reflects market saturation, not collapse. The U.S. remains Temu’s single largest user market.
European Union
- 141.6 million monthly active users
- 74% year-over-year growth
Europe is now Temu’s fastest-growing region.
United Kingdom
- 13.1 million monthly active users
- 16.3% year-over-year growth
Regional Share of Global Users
Temu ecommerce data shows a clear shift away from U.S.-only dependency.
- European Union accounts for 34% of Temu’s global user base
This shift explains Temu’s increasing focus on European expansion.
Temu Shopping App Statistics: Downloads and Engagement
Temu shopping app statistics highlight massive top-of-funnel reach.
- 1 billion cumulative app downloads reached in Q2 2025
In 2024 alone:
- 484.31 million app downloads worldwide
Monthly Download Peaks
Temu growth statistics show downloads occurring in strong promotional waves.
Key monthly milestones:
- July 2024: 60 million downloads
- October 2024: 52.57 million downloads
- June 2025: 113 million downloads
Average Time Spent in the App
Engagement is one of Temu’s strongest signals.
- 21 minutes per day spent in the Temu app
For comparison:
- Amazon: ~10 minutes
- eBay: ~11 minutes
- AliExpress: ~11 minutes
Website Traffic and Usage
Temu business statistics also show strong web performance.
- 1.8 billion monthly website visits (September 2025)
- Up from 1.23 billion in September 2024
Another dataset collected from AMZ Scout shows:
- 2.11 billion website visits in June 2025
- U.S. share of traffic: 31.6%
- Average session duration: 9 minutes 2 seconds
Temu Revenue 2025 and Financial Scale
Temu financial statistics focus on GMV rather than net revenue, which is standard for marketplaces.
- $70.8 billion GMV in 2024
- Up from $18 billion in 2023
Quarterly GMV Breakdown
Temu revenue growth accelerated throughout 2024.
- Q1 2024: $11.3B
- Q2 2024: $13.5B
- Q3 2024: $18.0B
- Q4 2024: $28.0B
- Q1 2025: $13.18B
- Q2 2025: $14.52B
Alternative GMV Dataset (Early Growth)
Another verified dataset from Business of Apps shows earlier-stage scaling:
- 2022: $290M
- H1 2023: $2.896B
- H2 2023: $12.26B
- H1 2024: $21.6B
Orders and Average Order Value
Temu processed:
- 412.3 million orders in 2023
Q4 2023 alone:
- 170 million orders
- 14.8× increase vs Q4 2022
Average Order Value (AOV)
Temu financial statistics show steady basket growth.
- Q4 2022: $24.0
- Q4 2023: $38.9
- 62.08% year-over-year increase
Brand Awareness and Adoption
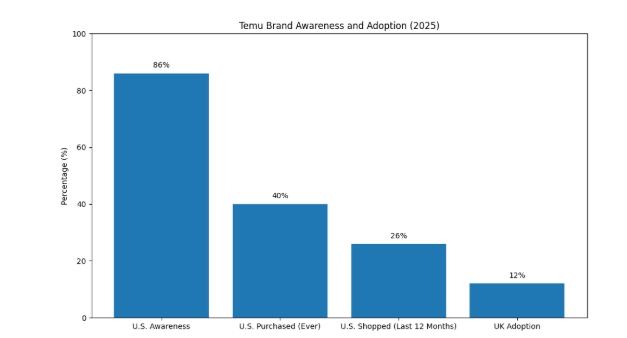
Temu business statistics confirm mainstream recognition.
- 86% of U.S. adults are aware of Temu
- 4 in 10 U.S. adults have made a purchase
Adoption rates:
- U.S.: 26% shopped on Temu in last 12 months
- UK: 12% adoption
Market Share and Competition
U.S. Discount Retail Market Share is as follows:
- 11% market share
- 17% market share
The difference reflects category definitions and methodology, not an error.
Seller Ecosystem and Product Scale
Temu business statistics show rapid supply-side expansion.
- ~100,000 U.S. sellers
- ~200,000 international sellers
Product depth:
- ~10 million SKUs globally
- ~2 million SKUs in the U.S.
Marketing Spend and Strategy Shift
Take a look at the following numbers:
- $3 billion marketing spend in 2023
- $2 billion spent on Meta Ads
In 2025:
- Google Shopping ads halted in the U.S.
- Facebook Ads reduced
- European ad spend increased:
- France: +40% MoM
- UK: +20% MoM
What Temu Statistics Indicate for 2026
Temu Statistics make several trends clear:
- Temu user growth is global, not U.S.-dependent
- Temu revenue 2025 remains strong despite reduced U.S. advertising
- Engagement metrics outperform traditional ecommerce apps
- Competitive pressure will intensify as scale increases
Temu is no longer a short-term phenomenon. Based on current Temu Statistics, it is now a structural player in global ecommerce.
Scale Faster as Temu Competition Intensifies
As per AWISEE, “Temu operates a hybrid creator system.” AWISEE supports brands with scalable Temu marketing services that adapt to regional demand, shifting ad spend, and evolving user behavior—before competition catches up.