

Europe’s ecommerce growth cannot be understood through one number. It requires context, comparison, and structure. That is where eCommerce Statistics Europe becomes essential. While overall ecommerce sales continue to rise, the pace and composition of that growth differ across borders. Some countries are saturated. Others are accelerating. Some rely on marketplaces. Others depend on owned digital storefronts.
Online shopping in Europe has moved past early adoption. Consumers across the EU routinely buy fashion, media, services, and travel online. Yet retail ecommerce penetration still varies widely. Enterprise participation also tells a separate story. Large companies adopt ecommerce faster. Smaller businesses follow cautiously. These differences shape the wider eCommerce market in Europe.
This article analyzes ecommerce through multiple lenses. Sales volume. Retail share. Consumer behavior. Enterprise adoption. Regional performance. All insights are based on official European sources.
Turn European eCommerce Data Into Market-Specific Growth
AWISEE helps brands translate European eCommerce statistics into country-level marketing strategies using influencer marketing, SEO, and high-authority link building tailored to each market.
eCommerce Statistics Europe: Market Size, Growth & Retail Impact

European ecommerce already operates at massive scale. As per Ecommercenews,
- In 2022, ecommerce sales in Europe reached €899 billion
- By 2023, the online B2C market turnover reached €741 billion
- Ecommerce sales are projected to reach €1.4 trillion by 2027
These Europe eCommerce market statistics show that growth remains strong, even as markets mature.
Western Europe still generates most online revenue. Other regions grow faster but from smaller bases. This pattern defines current European eCommerce data 2025.
Ecommerce vs Traditional Retail Sales in Europe
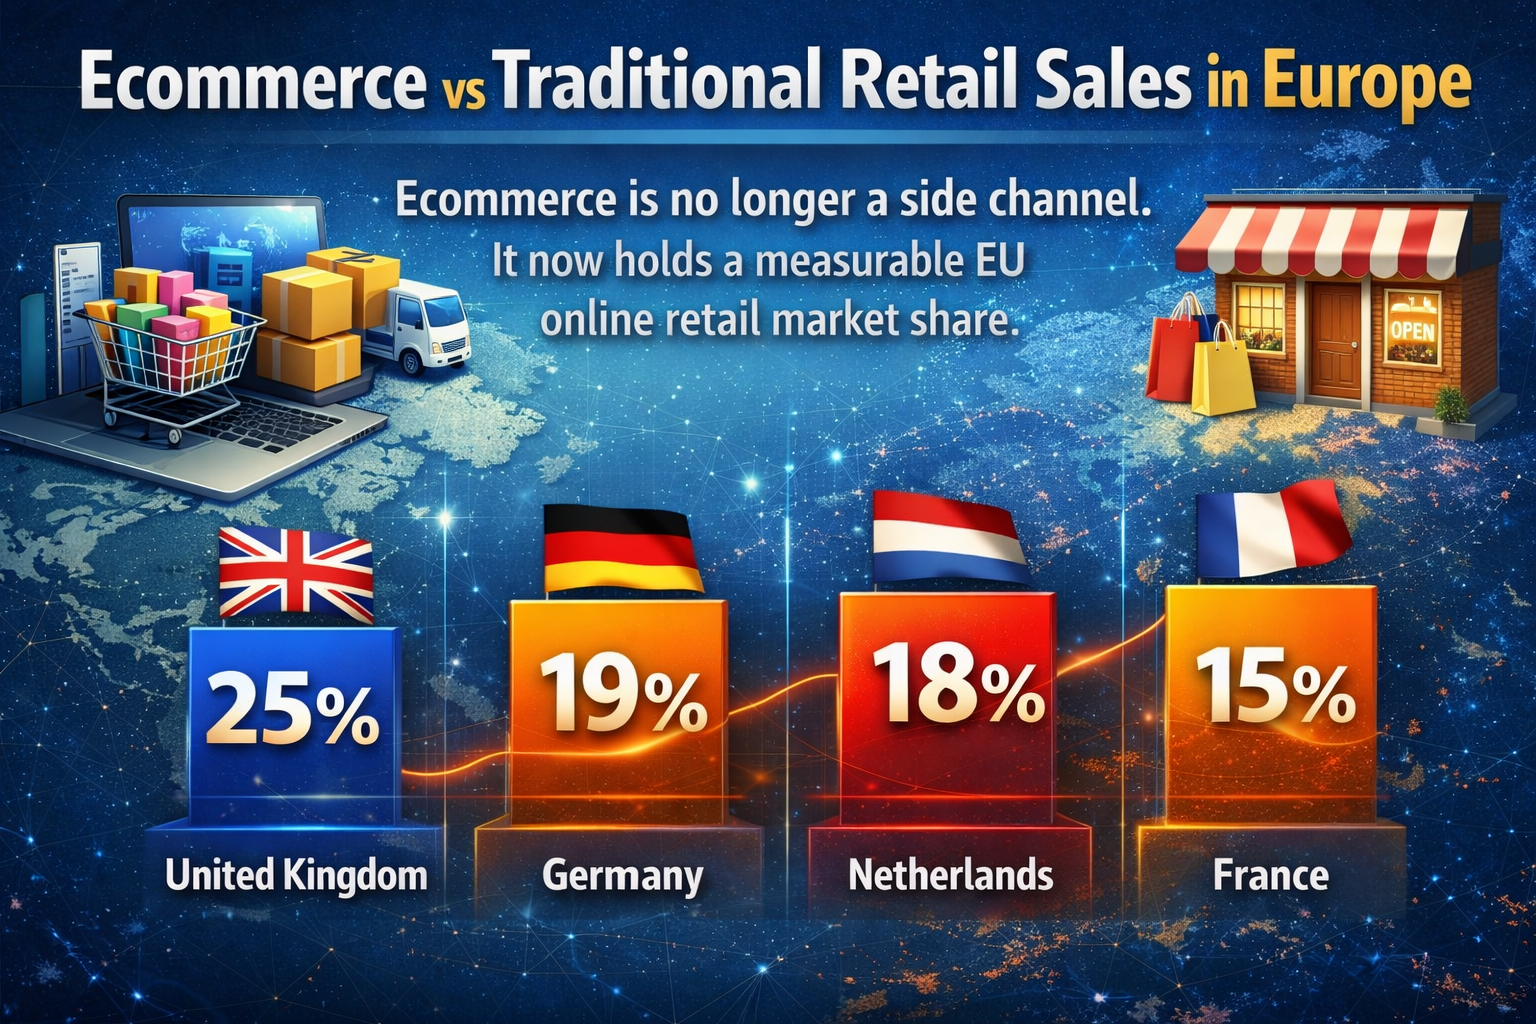
Ecommerce is no longer a side channel.
It now holds a measurable EU online retail market share.
In 2022, ecommerce accounted for:
- 25% of total retail sales in the United Kingdom
- 19% in Germany
- 18% in the Netherlands
- 15% in France
These figures explain why ecommerce strategies differ across countries. In the UK, ecommerce competes directly with physical retail. In Southern and Eastern Europe, online sales still complement offline shopping.
These insights sit at the core of eCommerce Statistics Europe.
Regional Contribution to European Ecommerce Revenue
Most ecommerce revenue still comes from one region.
- Western Europe: ~70% of total European ecommerce turnover
- Southern Europe: ~15%
- Northern Europe: ~7%
- Central Europe: ~6%
- Eastern Europe: ~1%
Revenue share alone does not tell the full story. Growth momentum is shifting east and south, where online shopper penetration remains lower. This shift is a defining trend in eCommerce in Europe statistics.
Online Shopping Statistics Europe: Consumers & Digital Behavior
Europe’s ecommerce growth is built on access.
- 91% of the European population used the internet in 2023
- 70% of Europeans bought goods or services online
These online shopping statistics Europe confirm that ecommerce is embedded in daily life.
Enterprises Participating in Ecommerce
Consumer behavior explains demand.
Enterprise adoption explains scale.
In 2023, Europa Eurostat reported:
- 23.83% of EU enterprises conducted e-sales
- Ecommerce accounted for 19.12% of total enterprise turnover
- Ecommerce turnover via own websites or apps was nearly six times higher than via marketplaces
This confirms a key theme in eCommerce Statistics Europe. Marketplaces drive visibility. Owned channels generate most revenue.
Ecommerce Adoption by Enterprise Size
Enterprise size strongly affects ecommerce participation.
In 2023:
- 46.45% of large enterprises conducted e-sales
- 30.51% of medium-sized enterprises conducted e-sales
- 21.88% of small enterprises conducted e-sales
Large enterprises generated nearly 24.44% of their total turnover from ecommerce. This structural gap shapes the eCommerce market in Europe.
Web Sales vs Marketplace Sales in Europe
European ecommerce relies on two main sales channels:
- Websites and mobile apps
- Automated EDI-type sales systems
In 2023:
- 17.69% of EU enterprises used only websites or apps
- 3.08% used only EDI
- 3.06% used both
Web sales dominated in every EU country, reinforcing patterns seen in Europe digital commerce statistics.
Ecommerce Turnover by Sales Channel
Sales volume and sales value behave differently.
In 2023:
- 7.32% of total turnover came from web sales
- 11.78% came from EDI-type sales
- Total ecommerce turnover reached 19.12% of enterprise revenue
This explains why B2B ecommerce remains structurally different from consumer ecommerce across the eCommerce market in Europe.
What Europeans Buy Online Most
Product category data explains why fashion dominates.
Across Europe:
- 68% of online purchases involve clothing, shoes, or accessories
- 34% involve physical media such as books, music, or DVDs
Fashion remains the backbone of eCommerce Statistics Europe.
Biggest Ecommerce Marketplaces in Europe
Marketplaces play a central role in European ecommerce.
In 2022:
- Amazon and eBay generated nearly €78 billion in GMV combined
- Amazon: €55 billion
- eBay: €23.2 billion
These platforms account for nearly half of marketplace-driven trade in Europe, shaping Europe eCommerce market statistics.
Top Marketplaces by Country Presence
Leading platforms include:
- Amazon.de
- Amazon.co.uk
- eBay.co.uk
- Allegro.pl
- Amazon.it
Despite Amazon’s dominance, several countries still favor local marketplaces. This fragmentation defines European eCommerce data 2025.
Cross-Border Shopping Europe Stats: How Buyers Move Beyond Borders
Cross-border ecommerce is no longer optional.
It is standard behavior.
In 2023, the European cross-border ecommerce market reached €237 billion. These cross-border shopping Europe stats show how connected European consumers have become.
Cross-border growth works because:
- Payment systems are interoperable
- Logistics networks span borders
- EU consumer protection laws build trust
Payment Methods Shaping European Ecommerce
Payment preferences differ sharply by country.
Across Europe:
- PayPal leads in Germany
- iDEAL dominates the Netherlands
- Bancontact leads in Belgium
- BNPL adoption continues to rise
In Spain, one in three consumers prefers installment payments.
In the UK, 15.35% of monthly online spend comes from BNPL.
These differences influence checkout strategy across the eCommerce market in Europe.
Europe eCommerce Market Statistics by Region
Here is a breakdown of Europe ecommerce market stats by region:
Western Europe
Western Europe generates most ecommerce revenue.
Key countries include Germany, the UK, France, the Netherlands, Belgium, Austria, and Switzerland. Germany and the UK remain the strongest ecommerce markets due to scale and spending power. Data collected by AWISEE shows that in 2025, 66.44% of Germany’s population shopped online.
Northern Europe & Scandinavia
Scandinavian markets show maturity rather than explosive growth.
Denmark, Sweden, Finland, and Norway rank among the highest in ecommerce turnover as a share of enterprise revenue.
In 2023:
- Denmark: 29.82%
- Finland: 28.87%
- Belgium: 28.77%
Southern Europe
Southern Europe grows faster than it earns.
Spain, Italy, Portugal, and Greece show lower penetration but rising momentum. Southern Europe currently accounts for 15% of total European ecommerce revenue.
Central & Eastern Europe
Eastern Europe is the fastest-growing ecommerce region.
Enterprise adoption varies widely. In 2023, e-sales participation ranged from 42.07% in Lithuania to 14.74% in Romania.
This variation defines the opportunity within eCommerce Statistics Europe.
Baltic Countries
The Baltic region consistently overperforms.
In 2023:
- 98.11% of Estonian enterprises with web sales used their own website
- Lithuania recorded the highest marketplace usage at 86.64%
What This Data Explains About Europe’s Ecommerce Future
European ecommerce remains stable, not saturated.
eCommerce Statistics Europe show:
- Strong foundations in Western and Northern Europe
- High growth potential in Eastern and Southern Europe
- Rising cross-border activity
- Continued dominance of fashion and marketplaces
Europe behaves as many connected markets, not one. Understanding European eCommerce data 2025 is where effective strategy begins.
Win Across Fragmented European eCommerce Markets
AWISEE supports brands with localized influencer campaigns, multilingual SEO, and region-specific link building strategies designed to perform across Western, Northern, Southern, and Eastern Europe.